Best Data Analytics Tools Every Beginner Should Learn in 2026
Discover the best data analytics tools every beginner should learn in 2026. From Excel and SQL to Python and Power BI, explore the complete roadmap with EEPL Classroom.
The demand for skilled data analysts has never been higher. Whether you are a student fresh out of college, a working professional planning a career switch, or someone exploring technology for the first time, learning the right data analytics tools is the most important step you can take right now. At EEPL Classroom, we have helped hundreds of students in Ranchi and across Jharkhand build real-world skills in data analytics software, business intelligence tools, and Python and this guide reflects exactly what we teach and why.
In this blog, we will walk you through every essential tool a beginner should know, the order in which you should learn them, which tools are free, and which ones companies actually use. If you have been searching for the most practical and honest roadmap to becoming a data analyst, you are in the right place.
What Tools Do Data Analysts Use? (Featured Snippet)
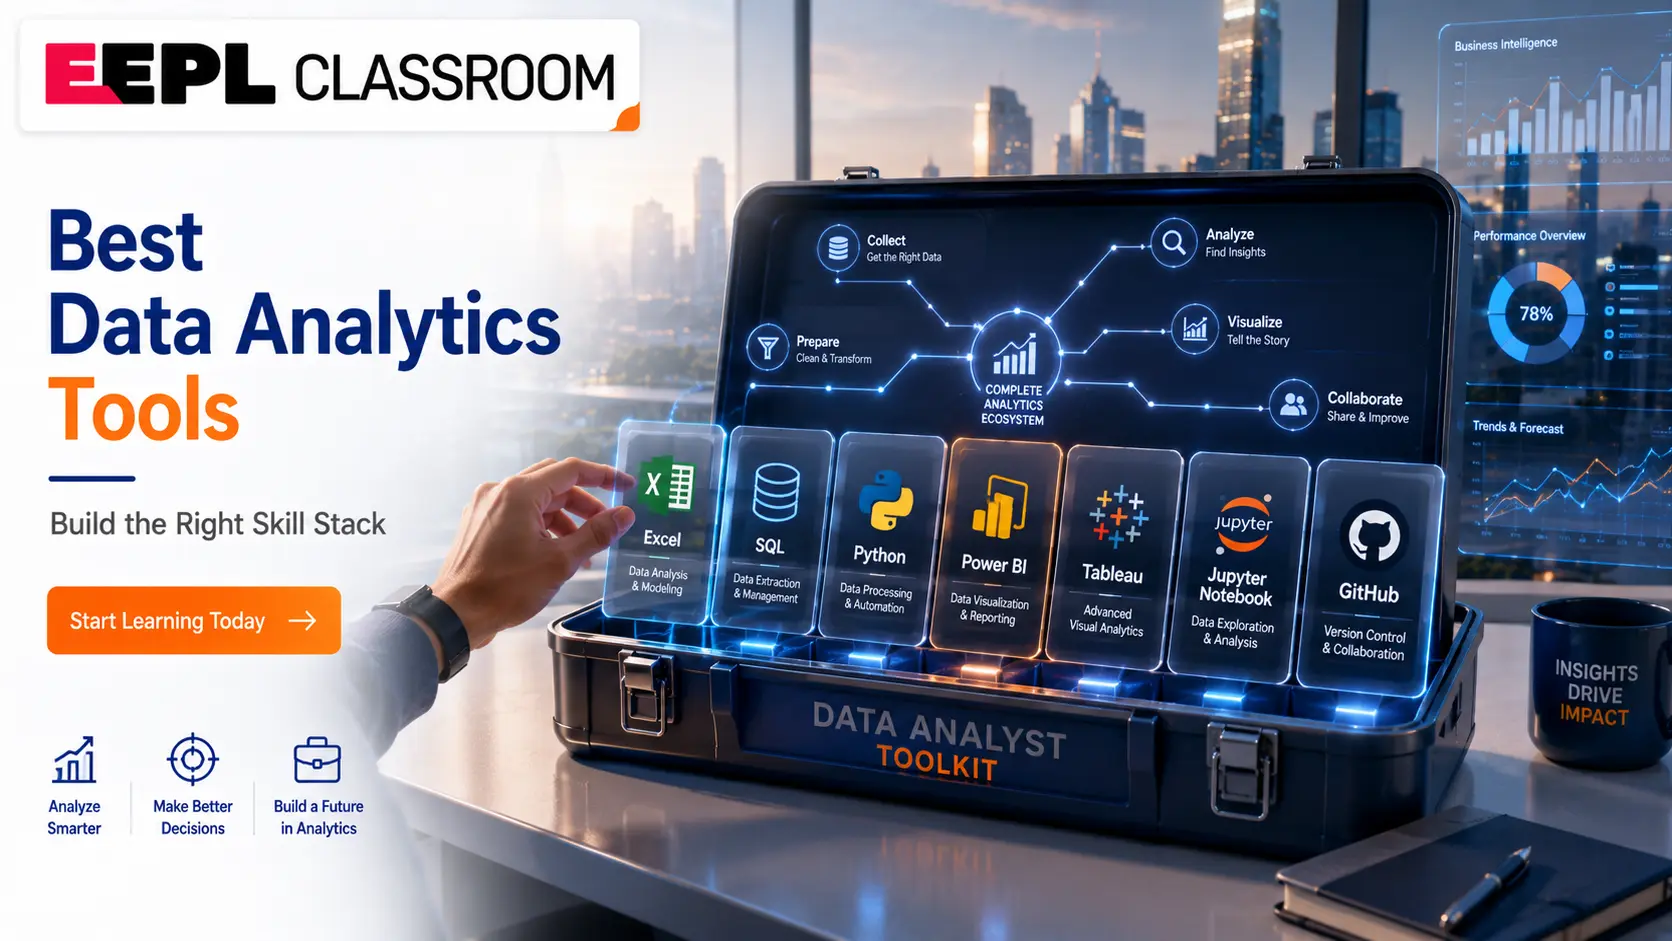
Most Data Analysts use the following data analyst tools in their daily work:
Microsoft Excel: data cleaning, pivot tables, and basic analysis
SQL: querying and managing databases
Power BI: business intelligence and interactive dashboards
Tableau: advanced data visualisation tools
Python: automation, statistical analysis, and machine learning
Google Sheets: collaborative spreadsheet work
R Programming: statistical computing and academic research
Jupyter Notebook: interactive Python coding environment
Git & GitHub: version control and project collaboration
Microsoft Fabric: modern enterprise analytics (optional for beginners)
Why Learning the Right Data Analytics Tools Matters
Many beginners make the mistake of jumping straight into complex tools without building a proper foundation. The right data analytics learning tools help you move from raw data to meaningful insights and that is what employers pay for.
Data analysis software helps you clean messy data, identify patterns, create reports, and support business decisions with evidence. Whether you aim to work in finance, healthcare, retail, or technology, these tools remain consistent across industries. The companies hiring data analysts today from startups to MNCs rely on tools like SQL, Python, and Power BI every single day.
At EEPL Classroom, our Data Analytics Course is structured around exactly these tools, ensuring students are job-ready from the very first week of practice.
The Complete List of Best Data Analytics Tools for Beginners
1. Microsoft Excel: The Starting Point for Every Beginner
Microsoft Excel is the most widely used data analysis software in the world. It is available in almost every workplace, free to learn through Microsoft Learn, and absolutely essential for anyone entering the data field. Beginners should start with Excel because it teaches core concepts sorting, filtering, formulas, and pivot tables without requiring any coding knowledge.
Excel is not just a beginner tool. Even senior analysts use it daily for quick data exploration and reporting. Our Advance Excel Course in Ranchi at EEPL Classroom covers everything from basic functions to advanced dashboards, making it one of the most popular short-term courses we offer.
Key Excel skills every beginner should master:
VLOOKUP, INDEX-MATCH, and IF functions
Pivot Tables and Pivot Charts
Conditional Formatting
Data Validation and Named Ranges
Basic Macros and Automation
2. SQL: The Language Every Data Analyst Must Know
If Excel is the foundation, SQL (Structured Query Language) is the engine that powers professional data analytics platforms. Almost every company stores its data in relational databases, and SQL is how analysts retrieve, filter, join, and summarise that data. Without SQL, you simply cannot call yourself a data analyst in today's job market.
SQL is free to learn and practise using tools like MySQL or PostgreSQL. Beginners should focus on SELECT statements, WHERE clauses, GROUP BY, JOINs, and subqueries. These concepts alone will allow you to handle 80% of real-world data tasks.
SQL also connects seamlessly with Python, Power BI, and Tableau, making it one of the most transferable tools required for data analytics at any level.
3. Power BI: Microsoft's Business Intelligence Powerhouse
Power BI is one of the most popular business intelligence tools used in corporate environments across India and globally. It allows analysts to connect to multiple data sources, build interactive dashboards, and share reports with stakeholders all without writing complex code.
Microsoft offers a strong learning path at Microsoft Learn for Power BI, and the desktop version is completely free to download and use. For beginners, Power BI bridges the gap between raw data and decision-makers. It is visual, intuitive, and directly applicable to business problems.
At EEPL Classroom, Power BI training is integrated within our Data Analytics programme, giving students hands-on experience with real datasets and dashboard projects before they even sit for an interview.
4. Python: The Most Powerful Tool in a Data Analyst's Kit
Python has become the most in-demand programming language for data analytics, machine learning, and data science. For beginners, Python may seem intimidating, but with the right guidance, it is one of the most learnable and rewarding tools in this field.
The key libraries every beginner should know include:
Pandas: for data manipulation and cleaning
NumPy: for numerical computing
Matplotlib & Seaborn: for data visualisation
Scikit-learn: for introductory machine learning
The Python Official Documentation is an excellent starting point, and our Python Course in Ranchi at EEPL Classroom takes students from complete beginner to project-ready in a structured, practical way. Python also connects directly with our Machine Learning Course, making it the ideal next step once your basics are solid.
5. Tableau: Visualise Data Like a Professional
Tableau is one of the leading data visualisation tools used by analysts across industries. It allows you to create compelling, interactive visual stories from your data; charts, maps, trend lines, and executive dashboards with a drag-and-drop interface that requires no coding.
Tableau Public is a completely free version that beginners can use to build and publish their projects online, which also doubles as a portfolio. Tableau is particularly valued in industries like consulting, banking, and e-commerce where visual storytelling is critical to business communication.
6. Jupyter Notebook: The Ideal Python Environment for Learners
Jupyter Notebook is an open-source, browser-based environment that allows you to write and run Python code in interactive blocks called cells. It is the most beginner-friendly way to start writing Python for data analysis because you can see the output of each step immediately.
Refer to the Jupyter official documentation for installation and usage guidance. Almost every data analytics course including ours, uses Jupyter Notebook as the primary coding environment for students learning data analysis software for the first time.
7. Google Sheets: Collaborative and Cloud-Based
Google Sheets is a free, cloud-based alternative to Excel that is widely used by startups, small businesses, and teams working remotely. For beginners, it offers a low-barrier entry point into spreadsheet-based analysis and is especially useful when collaborating with others in real-time.
While it does not replace Excel or SQL for heavy data work, Google Sheets is one of the most practical free data analytics tools you can start using today without installing anything.
8. Git & GitHub: Version Control for the Modern Analyst
Git and GitHub are tools that allow you to track changes in your code, collaborate with teammates, and maintain a professional portfolio of your projects. Many beginners overlook version control, but employers consistently look for candidates who manage their work professionally.
The GitHub Documentation covers everything from account setup to advanced collaboration workflows. If you are learning Python or SQL, pushing your projects to GitHub also creates a public portfolio that demonstrates your skills to recruiters a significant advantage in the job market.
9. R Programming: A Secondary but Valuable Tool
R Programming is primarily used in academia, research, and statistical computing. While Python has taken over for most practical data analytics work, R remains relevant in fields like biostatistics, social science research, and financial modelling.
Beginners do not need to prioritise R over Python, but it is worth knowing as one of the tools used by data analysts in specialised environments. Our faculty at EEPL Classroom recommends Python first for most career paths, with R as an optional addition later.
Recommended Learning Roadmap — Excel → SQL → Python → Power BI → Tableau
One of the most common questions beginners ask is: which tool should I learn first? The excel sql power bi python roadmap is the most structured and industry-validated path for aspiring data analysts:
Step 1: Excel: Build your spreadsheet foundation. Learn formulas, pivot tables, and basic data cleaning.
Step 2: SQL: Learn to query databases. Start with MySQL or PostgreSQL.
Step 3: Python: Learn Pandas, NumPy, and Matplotlib for analytical programming.
Step 4: Power BI or Tableau: Build dashboards and visualisations using cleaned data.
Step 5: Git & GitHub: Version control and portfolio building.
Step 6: Jupyter Notebook: Use it throughout your Python learning journey.
Follow this sequence and you will have a complete, employer-ready skill set within six to twelve months of consistent practice.
Which Data Analytics Tools Are Free?
A major concern for students is cost. Here is the good news — most essential beginner data analytics tools are free or have free versions:
Excel: free through Microsoft Learn for learning; available via Microsoft 365
SQ: MySQL and PostgreSQL are completely free
Python: open-source and free
Jupyter Notebook: free and open-source
Power BI Desktop: free to download and use
Tableau Public: free for personal and portfolio use
Google Sheets: free with a Google account
Git & GitHub: free for personal use
The tools themselves cost nothing. What makes the difference is structured guidance, hands-on projects, and mentorship, which is exactly what our Data Analytics Course at EEPL Classroom provides.
CTA 1:
Ready to start your journey into Data Analytics? Join EEPL Classroom's industry-aligned Data Analytics Course in Ranchi and learn from certified trainers with real-world experience. Enroll today and build the skills that companies are actively hiring for.
Which Tools Do Real Companies Actually Use?
Understanding which data analytics platforms are used in real workplaces helps students prioritise their learning. Based on current industry hiring trends across India:
SQL is required in nearly every data analyst job description
Python is the second most demanded skill
Power BI dominates the Indian corporate market for business intelligence software
Excel remains universal across all company sizes
Tableau is preferred in consulting, BFSI, and large enterprises
Git & GitHub are increasingly expected even for analyst roles, not just developers
Companies like Infosys, TCS, Wipro, Deloitte, and Amazon India actively recruit candidates with this combination of tools for data analysts. Our students at EEPL Classroom have been placed in roles that require exactly this toolkit.
CTA 2:
Are you a working professional looking to upskill? Explore our Python Course in Ranchi and Machine Learning Course — both designed with flexible timing for students and professionals. Speak to our Career Counseling team to find the right course for your goals.
Learn Data Analytics Tools in Ranchi | EEPL Classroom
If you are looking for structured, mentor-led training in Ranchi, EEPL Classroom is Jharkhand's most trusted computer training institute for data analytics, Python, Power BI, and related courses. Unlike franchise-based national institutes, we are a locally rooted institute that understands the career landscape for students in this region.
Our data analytics course in Ranchi covers all the essential tools for becoming a data analyst — from Excel and SQL through to Python, Power BI, and Tableau with live projects, certification, and placement support. We also offer a dedicated python course in Ranchi, power bi training in Ranchi, and specialised tracks in Machine Learning and Data Science.
Students from across Ranchi — including Lalpur, Harmu, Kanke, Bariatu, Doranda, Morabadi, and beyond — come to EEPL Classroom at Abhinandan Complex, Tharpakhna, Near Govt. Women's Polytechnic, Ranchi – 834001 to build skills that lead to real careers. Whether you are a student after 12th, a college graduate, or a professional seeking a career change, our data analyst training in Ranchi programme is designed for you.
Call us at +91 98351 31568 or visit eepl.me to learn more.
We also offer our ADCA Course in Ranchi and Java Course in Ranchi for students looking to build a broader technical foundation alongside their data skills.
CTA 3:
Not sure which course is right for you? Our expert team offers free Career Counseling to help you choose the right learning path based on your background and goals. Book your free session today and get personalized guidance from EEPL Classroom's experienced faculty.
Conclusion | Start with One Tool and Build from There
The journey to becoming a confident data analyst does not happen overnight — but it starts with the right tools and the right guidance. The data analytics tools covered in this guide — Excel, SQL, Python, Power BI, Tableau, Jupyter Notebook, and Git — represent the complete, practical toolkit that industry demands today.
The recommended learning order is clear: start with Excel, move to SQL, then Python, and layer in visualisation tools like Power BI and Tableau. Focus on building real-world projects at every stage rather than collecting certifications without practical application. The data analytics software you master today will directly determine the opportunities available to you tomorrow.
Career opportunities in data analytics, business intelligence, data science, and machine learning are growing rapidly in India — and Ranchi is no exception. Companies across sectors are building data teams, and they need people who know these tools and can apply them to real problems.
At EEPL Classroom, we believe every student deserves access to quality, practical education in data analytics. Master one tool at a time, build projects that demonstrate your skills, and never stop improving your analytical thinking. The data-driven world needs people exactly like you.
Frequently Asked Questions (FAQs) About Best Data Analytics Tools
What are the best data analytics tools for beginners?
The best tools for data analytics beginners are Microsoft Excel, SQL, Python, and Power BI. Excel teaches you the fundamentals, SQL helps you manage databases, Python enables automation and deeper analysis, and Power BI lets you build professional dashboards. Start in this order and you will have a strong, job-ready foundation.
Which tool should I learn first as a complete beginner?
Start with Microsoft Excel. It requires no coding knowledge and teaches you the core concepts of data analysis — sorting, filtering, formulas, and pivot tables. Once you are comfortable, move to SQL and then Python.
Is Python necessary for data analytics?
Yes, Python has become one of the most essential data analyst tools in the industry. Libraries like Pandas, NumPy, and Matplotlib make data manipulation, cleaning, and visualisation highly efficient. Most companies today expect at least basic Python skills from data analyst candidates.
Which data analytics tools are free to use?
Several powerful free data analytics tools are available: MySQL and PostgreSQL for SQL, Python and Jupyter Notebook (both open-source), Power BI Desktop (free download), Tableau Public (free for personal use), and Google Sheets (free with any Google account). You can build a complete skill set without spending anything on tools.
What is the difference between Power BI and Tableau?
Both are leading data visualisation tools, but they serve slightly different markets. Power BI is Microsoft's product, integrates seamlessly with Excel and Azure, and is dominant in Indian corporate environments. Tableau is more widely used in consulting and large enterprises globally. For beginners in India, learning Power BI first is generally more practical.
How long does it take to learn data analytics tools?
With consistent daily practice, most beginners can develop job-ready proficiency in the core data analytics tools — Excel, SQL, Python, and Power BI — within six to twelve months. A structured course like EEPL Classroom's Data Analytics Course significantly accelerates this timeline.
Do I need a degree in computer science to learn data analytics?
No. Data analytics is accessible to students from any academic background — commerce, arts, science, or engineering. What matters is your willingness to learn the tools, practise consistently, and build projects. Many of our students at EEPL Classroom come from non-technical backgrounds and go on to build strong careers in data analysis.
Is SQL used in real companies for data analytics?
Absolutely. SQL is one of the most universally required tools used by data analysts across all industries. It appears in nearly every data analyst job description. Whether you work at a startup or a large corporation, you will use SQL to query databases and extract insights from structured data.
What is the best way to learn data analytics tools in Ranchi?
The most effective way is to enrol in a structured, mentor-led programme like EEPL Classroom's data analytics course in Ranchi, which covers all essential tools with live projects and placement support. Self-study can supplement your learning, but hands-on guidance accelerates progress significantly.
Can data analytics tools help me get a job?
Yes, directly. Proficiency in Excel, SQL, Python, and Power BI is what most entry-level data analyst job descriptions require. Employers want candidates who can use these tools on real datasets — not just list them on a resume. Building projects with these data analytics platforms and showcasing them on GitHub is the most effective way to land your first role.